Yun Hao, Boqian Wang, Jinming Zhao, Ping Wang, Yali Zhao, Xiangdong Wang, Yan Zhao & Luo Zhang
Allergy, Asthma & Clinical Immunology volume 18, Article number: 20 (2022)
Abstract
Background
Allergic rhinitis (AR) is an upper respiratory tract inflammation disease caused by IgE-mediated reactions against inhaled allergens. The incidence of AR is significantly increasing throughout the world. Hence, more specific, and sensitive gene biomarkers and understanding the underlying pathways are necessary to further explore the AR pathogenesis.
Objective
To identify gene biomarkers in nasal mucosa and in blood from AR patients which could be used in AR diagnosis.
Methods
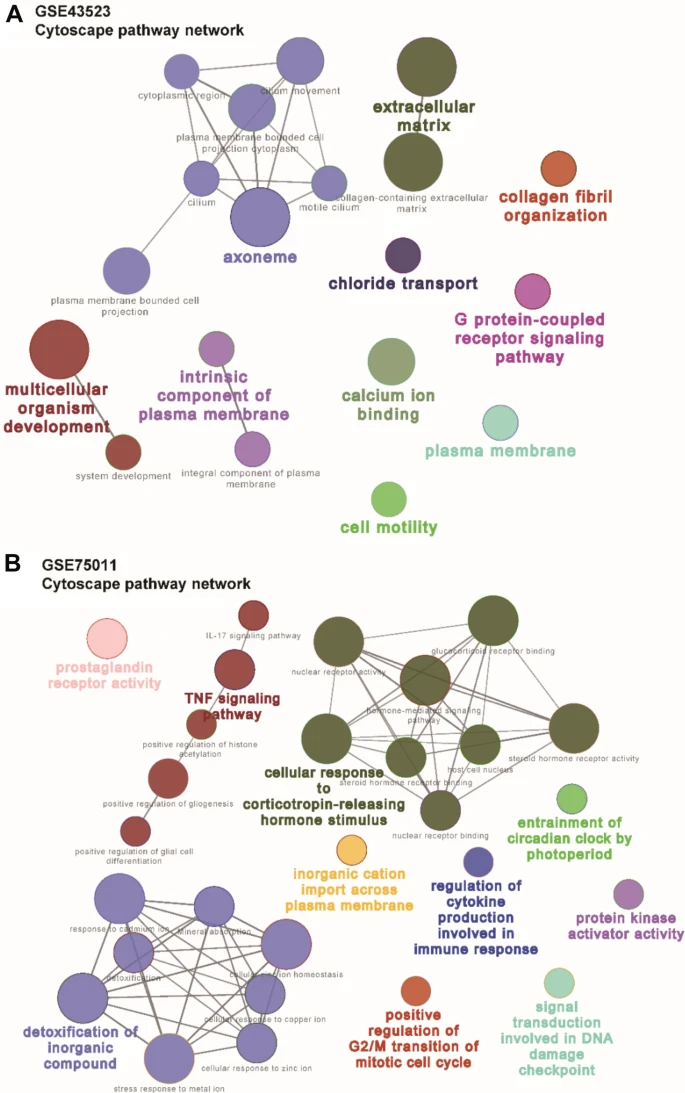
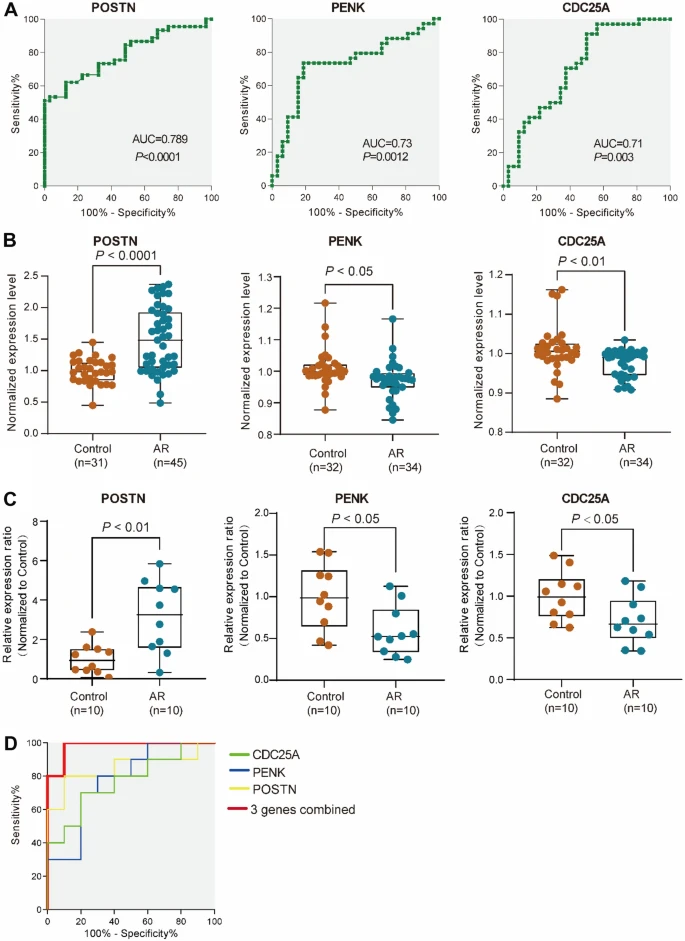
The gene expression profiles of GSE43523 from nasal epithelial cells and GSE75011 from Th2-enriched CD4+ T cells in blood were downloaded from the Gene Expression Omnibus database. Gene Ontology (GO), Kyoto Encyclopedia of Genes and Genomes (KEGG) analyses and protein–protein interaction (PPI) network analysis were conducted to investigate the functional changes of genes. The receiver operating characteristic (ROC) curves were used to assess the diagnostic values of the hub genes. Real-time quantitative PCR (RT-qPCR) was performed to validate the hub genes.
Results
Conclusion
This study utilized gene expression profiles and RT-qPCR validation on nasal mucosa and blood from AR patients to investigate the potential biomarkers for AR diagnosis.
No comments:
Post a Comment